Introduction
Purpose: To performa data analysis on a sample Titanic dataset.
This dataset contains demographics and passenger information from 891 of the 2224 passengers and crew on board the Titanic. You can view a description of this dataset on the Kaggle website, where the data was obtained (https://www.kaggle.com/c/titanic/data).
Questions
“One of the reasons that the shipwreck led to such loss of life was that there were not enough lifeboats for the passengers and crew. Although there was some element of luck involved in surviving the sinking, some groups of people were more likely to survive than others, such as women, children, and the upper- class.” - https://www.kaggle.com/c/titanic
What factors made people more likely to survive?
- Were social-economic standing a factor in survival rate?
- Did age, regardless of sex, determine your chances of survival?
- Did women and children have preference to lifeboats (survival)?
- Did women with children have a better survival rate vs women without children (adults 18+)?
Assumption: We are going to assume that everyone who survived made it to a life boat and it wasn’t by chance or luck.
Data Wrangling
Data Description
(from https://www.kaggle.com/c/titanic)
- survival: Survival (0 = No; 1 = Yes)
- pclass: Passenger Class (1 = 1st; 2 = 2nd; 3 = 3rd)
- name: Name
- sex: Sex
- age: Age
- sibsp: Number of Siblings/Spouses Aboard
- parch: Number of Parents/Children Aboard
- ticket: Ticket Number
- fare: Passenger Fare
- cabin: Cabin
- embarked: Port of Embarkation (C = Cherbourg; Q = Queenstown; S = Southampton)
Special Notes:
- Pclass is a proxy for socio-economic status (SES) 1st ~ Upper; 2nd ~ Middle; 3rd ~ Lower
- Age is in Years; Fractional if Age less than One (1) If the Age is Estimated, it is in the form xx.5
With respect to the family relation variables (i.e. sibsp and parch) some relations were ignored. The following are the definitions used for sibsp and parch.
- Sibling: Brother, Sister, Stepbrother, or Stepsister of Passenger Aboard Titanic
- Spouse: Husband or Wife of Passenger Aboard Titanic (Mistresses and Fiances Ignored)
- Parent: Mother or Father of Passenger Aboard Titanic
- Child: Son, Daughter, Stepson, or Stepdaughter of Passenger Aboard Titanic
Other family relatives excluded from this study include cousins, nephews/nieces, aunts/uncles, and in-laws. Some children travelled only with a nanny, therefore parch=0 for them. As well, some travelled with very close friends or neighbors in a village, however, the definitions do not support such relations.
In [308]:
# Render plots inline
%matplotlib inline

# Import libraries
import pandas as pd
import numpy as np
import matplotlib.pyplot as plt
import seaborn as sns

# Set style for all graphs
sns.set_style("dark")

# Read in the dataset, create dataframe
titanic_data = pd.read_csv('titanic_data.csv')
In [309]:
# Print the first few records to review data and format
titanic_data.head()| PassengerId | Survived | Pclass | Name | Sex | Age | SibSp | Parch | Ticket | Fare | Cabin | Embarked | |
|---|---|---|---|---|---|---|---|---|---|---|---|---|
| 0 | 1 | 0 | 3 | Braund, Mr. Owen Harris | male | 22.0 | 1 | 0 | A/5 21171 | 7.2500 | NaN | S |
| 1 | 2 | 1 | 1 | Cumings, Mrs. John Bradley (Florence Briggs Th... | female | 38.0 | 1 | 0 | PC 17599 | 71.2833 | C85 | C |
| 2 | 3 | 1 | 3 | Heikkinen, Miss. Laina | female | 26.0 | 0 | 0 | STON/O2. 3101282 | 7.9250 | NaN | S |
| 3 | 4 | 1 | 1 | Futrelle, Mrs. Jacques Heath (Lily May Peel) | female | 35.0 | 1 | 0 | 113803 | 53.1000 | C123 | S |
| 4 | 5 | 0 | 3 | Allen, Mr. William Henry | male | 35.0 | 0 | 0 | 373450 | 8.0500 | NaN | S |
In [310]:
# Print the last few records to review data and format
titanic_data.tail()| PassengerId | Survived | Pclass | Name | Sex | Age | SibSp | Parch | Ticket | Fare | Cabin | Embarked | |
|---|---|---|---|---|---|---|---|---|---|---|---|---|
| 886 | 887 | 0 | 2 | Montvila, Rev. Juozas | male | 27.0 | 0 | 0 | 211536 | 13.00 | NaN | S |
| 887 | 888 | 1 | 1 | Graham, Miss. Margaret Edith | female | 19.0 | 0 | 0 | 112053 | 30.00 | B42 | S |
| 888 | 889 | 0 | 3 | Johnston, Miss. Catherine Helen "Carrie" | female | NaN | 1 | 2 | W./C. 6607 | 23.45 | NaN | S |
| 889 | 890 | 1 | 1 | Behr, Mr. Karl Howell | male | 26.0 | 0 | 0 | 111369 | 30.00 | C148 | C |
| 890 | 891 | 0 | 3 | Dooley, Mr. Patrick | male | 32.0 | 0 | 0 | 370376 | 7.75 | NaN | Q |
Note: Some values for Age are NaN, while ticket and cabin values are alphanumeric and also missing values with NaN. Not a big deal but good to know. Based on current questions, will not require either Ticket or Cabin data.
Additional potential questions from reading data and data description
- How did children with nannies fare in comparison to children with parents. Did the nanny “abandon” the child to save his/her own life?
- I would need additional information to determine if a child was indeed only on board with a nanny. For example, a child could be on board with an adult sibling. This would make Parch (parent) = 0 but it would be incorrect to say the child had a nanny.
- Need to review list for children with no siblings. These will be children with nannies; however, a child could have siblings and still have a nanny as well. Potential question Q5
- Did cabin location play a part in the survival rate without the consideration of class
- No data on where the cabins are actually located on the Titanic
- External source of this data could probably be found
Data Cleanup
From the data description and questions to answer, I’ve determined that some dataset columns will not play a part in my analysis and these columns can therefore be removed. This will decluster the dataset and also help with processing performance of the dataset.
- PassengerId
- Name
- Ticket
- Cabin
- Fare
- Embarked
I’ll take a 3 step approach to data cleanup
- Identify and remove any duplicate entries
- Remove unnecessary columns
- Fix missing and data format issues
Step 1 - Remove duplicate entries
Concluded that no duplicate entires exist, based on tests below
In [275]:
# Identify and remove duplicate entries
titanic_data_duplicates = titanic_data.duplicated()
print 'Number of duplicate entries is/are {}'.format(titanic_data_duplicates.sum())
Number of duplicate entries is/are 0
In [315]:
# Let us just make sure this is working
duplicate_test = titanic_data.duplicated('Age').head()
print 'Number of entries with duplicate age in top entires are {}'.format(duplicate_test.sum())
titanic_data.head()
Number of entries with duplicate age in top entires are 1
| PassengerId | Survived | Pclass | Name | Sex | Age | SibSp | Parch | Ticket | Fare | Cabin | Embarked | |
|---|---|---|---|---|---|---|---|---|---|---|---|---|
| 0 | 1 | 0 | 3 | Braund, Mr. Owen Harris | male | 22.0 | 1 | 0 | A/5 21171 | 7.2500 | NaN | S |
| 1 | 2 | 1 | 1 | Cumings, Mrs. John Bradley (Florence Briggs Th... | female | 38.0 | 1 | 0 | PC 17599 | 71.2833 | C85 | C |
| 2 | 3 | 1 | 3 | Heikkinen, Miss. Laina | female | 26.0 | 0 | 0 | STON/O2. 3101282 | 7.9250 | NaN | S |
| 3 | 4 | 1 | 1 | Futrelle, Mrs. Jacques Heath (Lily May Peel) | female | 35.0 | 1 | 0 | 113803 | 53.1000 | C123 | S |
| 4 | 5 | 0 | 3 | Allen, Mr. William Henry | male | 35.0 | 0 | 0 | 373450 | 8.0500 | NaN | S |
Step 2 - Remove unnecessary columns
Columns (PassengerId, Name, Ticket, Cabin, Fare, Embarked) removed
In [316]:
# Create new dataset without unwanted columns
titanic_data_cleaned = titanic_data.drop(['PassengerId','Name','Ticket','Cabin','Fare','Embarked'], axis=1)
titanic_data_cleaned.head()| Survived | Pclass | Sex | Age | SibSp | Parch | |
|---|---|---|---|---|---|---|
| 0 | 0 | 3 | male | 22.0 | 1 | 0 |
| 1 | 1 | 1 | female | 38.0 | 1 | 0 |
| 2 | 1 | 3 | female | 26.0 | 0 | 0 |
| 3 | 1 | 1 | female | 35.0 | 1 | 0 |
| 4 | 0 | 3 | male | 35.0 | 0 | 0 |
Step 3 - Fix any missing or data format issues
In [278]:
# Calculate number of missing values
titanic_data_cleaned.isnull().sum()
Survived 0
Pclass 0
Sex 0
Age 177
SibSp 0
Parch 0
dtype: int64
In [279]:
# Review some of the missing Age data
missing_age_bool = pd.isnull(titanic_data_cleaned['Age'])
titanic_data_cleaned[missing_age_bool].head()| Survived | Pclass | Sex | Age | SibSp | Parch | |
|---|---|---|---|---|---|---|
| 5 | 0 | 3 | male | NaN | 0 | 0 |
| 17 | 1 | 2 | male | NaN | 0 | 0 |
| 19 | 1 | 3 | female | NaN | 0 | 0 |
| 26 | 0 | 3 | male | NaN | 0 | 0 |
| 28 | 1 | 3 | female | NaN | 0 | 0 |
In [317]:
# Determine number of males and females with missing age values
missing_age_female = titanic_data_cleaned[missing_age_bool]['Sex'] == 'female'
missing_age_male = titanic_data_cleaned[missing_age_bool]['Sex'] == 'male'

print 'Number for females and males with age missing are {} and {} respectively'.format(
missing_age_female.sum(),missing_age_male.sum())
Number for females and males with age missing are 53 and 124 respectively
In [318]:
# Taking a look at the datatypes
titanic_data_cleaned.info()
<class 'pandas.core.frame.DataFrame'>
RangeIndex: 891 entries, 0 to 890
Data columns (total 6 columns):
Survived 891 non-null int64
Pclass 891 non-null int64
Sex 891 non-null object
Age 714 non-null float64
SibSp 891 non-null int64
Parch 891 non-null int64
dtypes: float64(1), int64(4), object(1)
memory usage: 41.8+ KB
Missing Age data will affect Q2 - Did age, regardless of sex, determine your chances of survival? But graphing and summations shouldn’t be a problem since they will be treated as zero(0) value. However, 177 is roughly 20% of our 891 sample dataset which seems like a lot to discount. Also, this needs to be accounted for if reviewing descriptive stats such as mean age.
Should keep note of the proportions across male and female…
- Age missing in male data: 124
- Age missing in female data: 53
Data Exploration and Visualization
In [282]:
# Looking at some typical descriptive statistics
titanic_data_cleaned.describe()| Survived | Pclass | Age | SibSp | Parch | |
|---|---|---|---|---|---|
| count | 891.000000 | 891.000000 | 714.000000 | 891.000000 | 891.000000 |
| mean | 0.383838 | 2.308642 | 29.699118 | 0.523008 | 0.381594 |
| std | 0.486592 | 0.836071 | 14.526497 | 1.102743 | 0.806057 |
| min | 0.000000 | 1.000000 | 0.420000 | 0.000000 | 0.000000 |
| 25% | 0.000000 | 2.000000 | 20.125000 | 0.000000 | 0.000000 |
| 50% | 0.000000 | 3.000000 | 28.000000 | 0.000000 | 0.000000 |
| 75% | 1.000000 | 3.000000 | 38.000000 | 1.000000 | 0.000000 |
| max | 1.000000 | 3.000000 | 80.000000 | 8.000000 | 6.000000 |
In [283]:
# Age min at 0.42 looks a bit weird so give a closer look
titanic_data_cleaned[titanic_data_cleaned['Age'] < 1]| Survived | Pclass | Sex | Age | SibSp | Parch | |
|---|---|---|---|---|---|---|
| 78 | 1 | 2 | male | 0.83 | 0 | 2 |
| 305 | 1 | 1 | male | 0.92 | 1 | 2 |
| 469 | 1 | 3 | female | 0.75 | 2 | 1 |
| 644 | 1 | 3 | female | 0.75 | 2 | 1 |
| 755 | 1 | 2 | male | 0.67 | 1 | 1 |
| 803 | 1 | 3 | male | 0.42 | 0 | 1 |
| 831 | 1 | 2 | male | 0.83 | 1 | 1 |
In [284]:
# Taking a look at some survival rates for babies
youngest_to_survive = titanic_data_cleaned[titanic_data_cleaned['Survived'] == True]['Age'].min()
youngest_to_die = titanic_data_cleaned[titanic_data_cleaned['Survived'] == False]['Age'].min()
oldest_to_survive = titanic_data_cleaned[titanic_data_cleaned['Survived'] == True]['Age'].max()
oldest_to_die = titanic_data_cleaned[titanic_data_cleaned['Survived'] == False]['Age'].max()

print 'Youngest to survive: {} \nYoungest to die: {} \nOldest to survive: {} \nOldest to die: {}'.format(
youngest_to_survive, youngest_to_die, oldest_to_survive, oldest_to_die)
Youngest to survive: 0.42
Youngest to die: 1.0
Oldest to survive: 80.0
Oldest to die: 74.0
Data description states that Age can be fractional - Age is in Years; Fractional if Age less than One (1) If the Age is Estimated, it is in the form xx.5 - Therefore, 0.42 appears to be expected and normal data
Note: An interesting note is that all “new borns” survived. Potential Q6
- At what age did children’s survival rate match that of adults, if ever.
Other notable stats
- Oldest to survive: 80
- Oldest to die: 74
- Youngest to survive: < 1 (0.42)
- Youngest to die: 1
Question 1
Were social-economic standing a factor in survival rate?
In [285]:
# Returns survival rate/percentage of sex and class
def survival_rate(pclass, sex):
    """
    Args:
        pclass: class value 1,2 or 3
        sex: male or female
    Returns:
        survival rate as percentage.
    """
    grouped_by_total = titanic_data_cleaned.groupby(['Pclass', 'Sex']).size()[pclass,sex].astype('float')
    grouped_by_survived_sex = \
        titanic_data_cleaned.groupby(['Pclass','Survived','Sex']).size()[pclass,1,sex].astype('float')
    survived_sex_pct = (grouped_by_survived_sex / grouped_by_total * 100).round(2)

    return survived_sex_pct
In [286]:
# Get the actual numbers grouped by class, suvival and sex
groupedby_class_survived_size = titanic_data_cleaned.groupby(['Pclass','Survived','Sex']).size()
# Print - Grouped by class, survival and sex
print groupedby_class_survived_size
print 'Class 1 - female survival rate: {}%'.format(survival_rate(1,'female'))
print 'Class 1 - male survival rate: {}%'.format(survival_rate(1,'male'))
print '-----'
print 'Class 2 - female survival rate: {}%'.format(survival_rate(2,'female'))
print 'Class 2 - male survival rate: {}%'.format(survival_rate(2,'male'))
print '-----'
print 'Class 3 - female survival rate: {}%'.format(survival_rate(3,'female'))
print 'Class 3 - male survival rate: {}%'.format(survival_rate(3,'male'))
# Graph - Grouped by class, survival and sex
g = sns.factorplot(x="Sex", y="Survived", col="Pclass", data=titanic_data_cleaned,
saturation=.5, kind="bar", ci=None, size=5, aspect=.8)
# Fix up the labels
(g.set_axis_labels('', 'Survival Rate')
.set_xticklabels(["Men", "Women"])
.set_titles("Class {col_name}")
.set(ylim=(0, 1))
.despine(left=True, bottom=True))
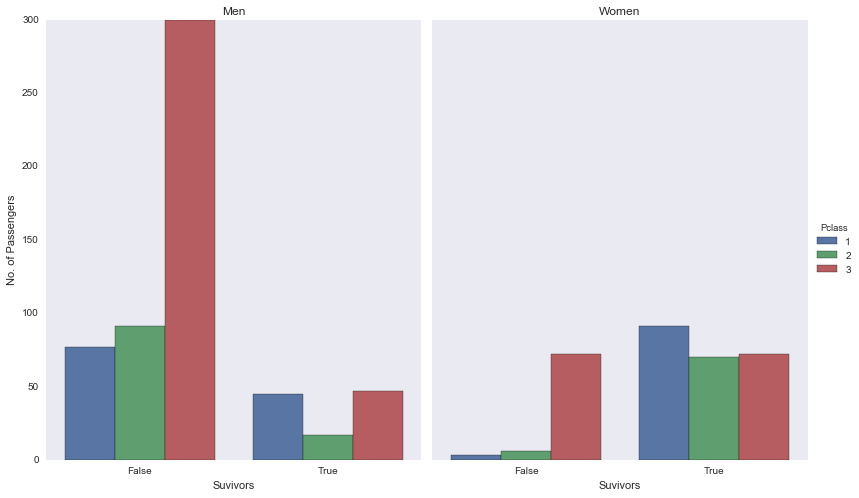
# Graph - Actual count of passengers by survival, group and sex
g = sns.factorplot('Survived', col='Sex', hue='Pclass', data=titanic_data_cleaned, kind='count', size=7, aspect=.8)
# Fix up the labels
(g.set_axis_labels('Suvivors', 'No. of Passengers')
.set_xticklabels(["False", "True"])
.set_titles('{col_name}')
)
titles = ['Men', 'Women']
for ax, title in zip(g.axes.flat, titles):
ax.set_title(title)Pclass Survived Sex
1 0 female 3
male 77
1 female 91
male 45
2 0 female 6
male 91
1 female 70
male 17
3 0 female 72
male 300
1 female 72
male 47
dtype: int64
Class 1 - female survival rate: 96.81%
Class 1 - male survival rate: 36.89%
-----
Class 2 - female survival rate: 92.11%
Class 2 - male survival rate: 15.74%
-----
Class 3 - female survival rate: 50.0%
Class 3 - male survival rate: 13.54%
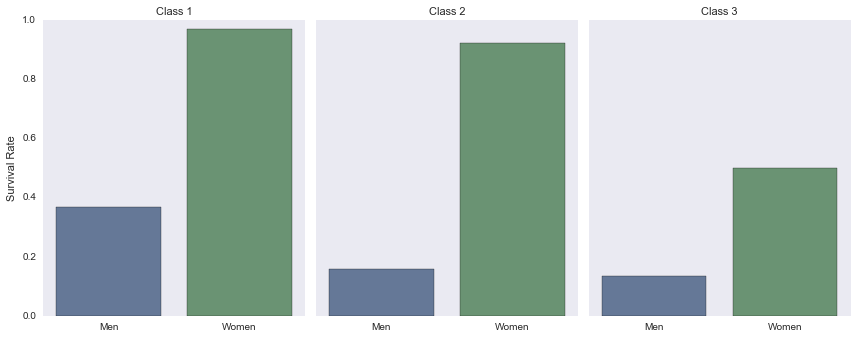
Based on the raw numbers it would appear as though passengers in Class 3 had a similar survival rate as those from Class 1 with 119 and 136 passengers surviving respectively. However, looking at the percentages of the overall passengers per class and the total numbers across each class, it can be assumed that a passenger from Class 1 is about 2.5x times more likely to survive than a passenger in Class 3.
Social-economic standing was a factor in survival rate of passengers.
- Class 1: 62.96%
- Class 2: 47.28%
- Class 3: 24.24%
Question 2
Did age, regardless of sex and class, determine your chances of survival?
In [287]:
# Let us first identify and get rid of records with missing Age
print 'Number of men and woman with age missing are {} and {} respectively'.format(
missing_age_female.sum(),missing_age_male.sum())

# Drop the NaN values. Calculations will be okay with them (seen as zero) but will throw off averages and counts
titanic_data_age_cleaned = titanic_data_cleaned.dropna()

# Find total count of survivors and those who didn't
number_survived = titanic_data_age_cleaned[titanic_data_age_cleaned['Survived'] == True]['Survived'].count()
number_died = titanic_data_age_cleaned[titanic_data_age_cleaned['Survived'] == False]['Survived'].count()

# Find average of survivors and those who didn't
mean_age_survived = titanic_data_age_cleaned[titanic_data_age_cleaned['Survived'] == True]['Age'].mean()
mean_age_died = titanic_data_age_cleaned[titanic_data_age_cleaned['Survived'] == False]['Age'].mean()

# Display a few raw totals
print 'Total number of survivors {} \n\
Total number of non survivors {} \n\
Mean age of survivors {} \n\
Mean age of non survivors {} \n\
Oldest to survive {} \n\
Oldest to not survive {}' \
.format(number_survived, number_died, np.round(mean_age_survived),
        np.round(mean_age_died), oldest_to_survive, oldest_to_die)

# Graph - Age of passengers across sex of those who survived
g = sns.factorplot(x="Survived", y="Age", hue='Sex', data=titanic_data_age_cleaned, kind="box", size=7, aspect=.8)

# Fix up the labels
(g.set_axis_labels('Suvivors', 'Age of Passengers')
    .set_xticklabels(["False", "True"])
)
Number of men and woman with age missing are 53 and 124 respectively
Total number of survivors 290
Total number of non survivors 424
Mean age of survivors 28.0
Mean age of non survivors 31.0
Oldest to survive 80.0
Oldest to not survive 74.0
<seaborn.axisgrid.FacetGrid at 0x11e550810>
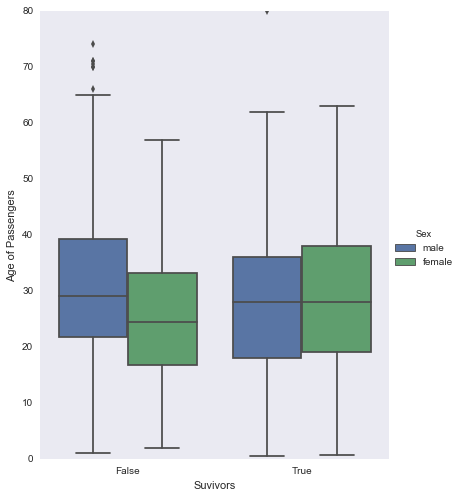
Based on the above boxplot and calculated data, it would appear that:
- Regardless of sex and class, age was not a deciding factor in the passenger survival rate
- Average age for those who survived and even those who did not survive were inline with eachother
Question 3
Did women and children have preference to lifeboats and therefore survival (assuming there was no shortage of lifeboats)?
Assumption: With “child” not classified in the data, I’ll need to assume a cutoff point. Therefore, I’ll be using today’s standard of under 18 as those to be considered as a child vs adult
In [288]:
# Create Cateogry column and categorize people
titanic_data_age_cleaned.loc[
    ( (titanic_data_age_cleaned['Sex'] == 'female') &
    (titanic_data_age_cleaned['Age'] >= 18) ),
    'Category'] = 'Woman'

titanic_data_age_cleaned.loc[
    ( (titanic_data_age_cleaned['Sex'] == 'male') &
    (titanic_data_age_cleaned['Age'] >= 18) ),
    'Category'] = 'Man'

titanic_data_age_cleaned.loc[
    (titanic_data_age_cleaned['Age'] < 18),
    'Category'] = 'Child'

# Get the totals grouped by Men, Women and Children, and by survival
print titanic_data_age_cleaned.groupby(['Category','Survived']).size()

# Graph - Compare survival count between Men, Women and Children
g = sns.factorplot('Survived', col='Category', data=titanic_data_age_cleaned, kind='count', size=7, aspect=.8)

# Fix up the labels
(g.set_axis_labels('Suvivors', 'No. of Passengers')
    .set_xticklabels(['False', 'True'])
)

titles = ['Men', 'Women', 'Children']
for ax, title in zip(g.axes.flat, titles):
    ax.set_title(title)
Category Survived
Child 0 52
1 61
Man 0 325
1 70
Woman 0 47
1 159
dtype: int64
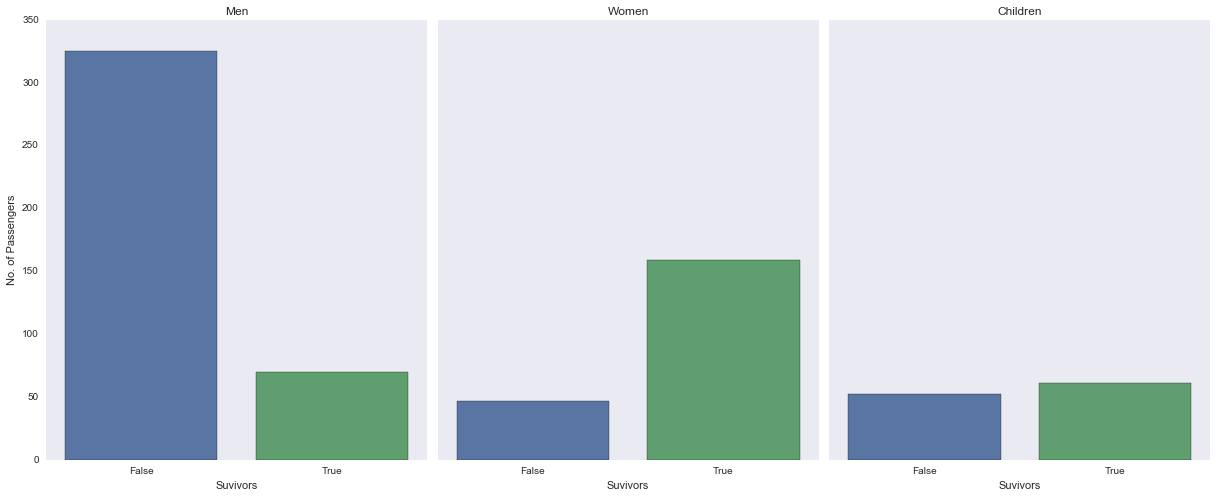
The data, and more so, the graphs tends to support the idea that “women and children first” possibly played a role in the survival of a number of people. It’s a bit surprising that more children didn’t survive but this could possibly be attributed to the mis-representation of what age is considered as the cut off for adults - i.e. if in the 1900’s someone 15-17 were considered adults, they would not have been “saved” under the “women and children first” idea and would be made to fend for themselves. That would in turn, change the outcome of the above data and possible increase the number of children who survived.
Question 4
Did women with children have a better survival rate vs women without children (adults 18+)?
- “Women with children” is referring to parents only
In [289]:
# Determine number of woman that are not parents
titanic_data_woman_parents = titanic_data_age_cleaned.loc[
    (titanic_data_age_cleaned['Category'] == 'Woman') &
    (titanic_data_age_cleaned['Parch'] > 0)]

# Determine number of woman over 20 that are not parents
titanic_data_woman_parents_maybe = titanic_data_age_cleaned.loc[
    (titanic_data_age_cleaned['Category'] == 'Woman') &
    (titanic_data_age_cleaned['Parch'] > 0) &
    (titanic_data_age_cleaned['Age'] > 20)]
In [290]:
titanic_data_woman_parents.head()| Survived | Pclass | Sex | Age | SibSp | Parch | Category | |
|---|---|---|---|---|---|---|---|
| 8 | 1 | 3 | female | 27.0 | 0 | 2 | Woman |
| 25 | 1 | 3 | female | 38.0 | 1 | 5 | Woman |
| 88 | 1 | 1 | female | 23.0 | 3 | 2 | Woman |
| 98 | 1 | 2 | female | 34.0 | 0 | 1 | Woman |
| 136 | 1 | 1 | female | 19.0 | 0 | 2 | Woman |
In [291]:
titanic_data_woman_parents_maybe.head()| Survived | Pclass | Sex | Age | SibSp | Parch | Category | |
|---|---|---|---|---|---|---|---|
| 8 | 1 | 3 | female | 27.0 | 0 | 2 | Woman |
| 25 | 1 | 3 | female | 38.0 | 1 | 5 | Woman |
| 88 | 1 | 1 | female | 23.0 | 3 | 2 | Woman |
| 98 | 1 | 2 | female | 34.0 | 0 | 1 | Woman |
| 167 | 0 | 3 | female | 45.0 | 1 | 4 | Woman |
After reviewing the data, and giving it a bit more thought, I noticed a issue which I didn’t think of before i.e A woman with Age: 23 and Parch: 2 could be onboard with her children OR onboard with her parents. Based on the ‘Parch’ definition provided in the data description, Parch - number of parents or children on board, I don’t believe it’s possible to accurately determine women with children (parents) vs women with their parents onboard.
Question 5
How did children with nannies fare in comparison to children with parents. Did the nanny “abandon” children to save his/her own life?
- Need to review list for children with no parents. These will be children with nannies as stated in the data description
- Compare “normal” survival rate of children with parents against children with nannies
Assumptions:
- If you’re classified as a ‘Child’ (under 18) and have Parch > 0, then the value is associated to your Parents, eventhough it is possible to be under 18 and also have children
- Classifying people as ‘Child’ represented by those under 18 years old is applying today’s standards to the 1900 century
In [292]:
# Separate out children with parents from those with nannies
titanic_data_children_nannies = titanic_data_age_cleaned.loc[
    (titanic_data_age_cleaned['Category'] == 'Child') &
    (titanic_data_age_cleaned['Parch'] == 0)]

titanic_data_children_parents = titanic_data_age_cleaned.loc[
    (titanic_data_age_cleaned['Category'] == 'Child') &
    (titanic_data_age_cleaned['Parch'] > 0)]
In [307]:
# Determine children with nannies who survived and who did not
survived_children_nannies = titanic_data_children_nannies.Survived.sum()
total_children_nannies = titanic_data_children_nannies.Survived.count()
pct_survived_nannies = ((float(survived_children_nannies)/total_children_nannies)*100)
pct_survived_nannies = np.round(pct_survived_nannies,2)
survived_children_nannies_avg_age = np.round(titanic_data_children_nannies.Age.mean())

# Display results
print 'Total number of children with nannies: {}\n\
Children with nannies who survived: {}\n\
Children with nannies who did not survive: {}\n\
Percentage of children who survived: {}%\n\
Average age of surviving children: {}'\
.format(total_children_nannies, survived_children_nannies,
        total_children_nannies-survived_children_nannies, pct_survived_nannies, survived_children_nannies_avg_age)

# Verify counts (looked a bit too evenly divided)
titanic_data_children_nannies.loc[titanic_data_children_nannies['Survived'] == 1]
Total number of children with nannies: 32
Children with nannies who survived: 16
Children with nannies who did not survive: 16
Percentage of children who survived: 50.0%
Average age of surviving children: 15.0
| Survived | Pclass | Sex | Age | SibSp | Parch | Category | |
|---|---|---|---|---|---|---|---|
| 9 | 1 | 2 | female | 14.0 | 1 | 0 | Child |
| 22 | 1 | 3 | female | 15.0 | 0 | 0 | Child |
| 39 | 1 | 3 | female | 14.0 | 1 | 0 | Child |
| 84 | 1 | 2 | female | 17.0 | 0 | 0 | Child |
| 125 | 1 | 3 | male | 12.0 | 1 | 0 | Child |
| 156 | 1 | 3 | female | 16.0 | 0 | 0 | Child |
| 208 | 1 | 3 | female | 16.0 | 0 | 0 | Child |
| 220 | 1 | 3 | male | 16.0 | 0 | 0 | Child |
| 307 | 1 | 1 | female | 17.0 | 1 | 0 | Child |
| 389 | 1 | 2 | female | 17.0 | 0 | 0 | Child |
| 504 | 1 | 1 | female | 16.0 | 0 | 0 | Child |
| 777 | 1 | 3 | female | 5.0 | 0 | 0 | Child |
| 780 | 1 | 3 | female | 13.0 | 0 | 0 | Child |
| 781 | 1 | 1 | female | 17.0 | 1 | 0 | Child |
| 830 | 1 | 3 | female | 15.0 | 1 | 0 | Child |
| 875 | 1 | 3 | female | 15.0 | 0 | 0 | Child |
In [304]:
# Determine children with parents who survived and who did not
survived_children_parents = titanic_data_children_parents.Survived.sum()
total_children_parents = titanic_data_children_parents.Survived.count()
pct_survived_parents = ((float(survived_children_parents)/total_children_parents)*100)
pct_survived_parents = np.round(pct_survived_parents,2)
survived_children_parents_avg_age = np.round(titanic_data_children_parents.Age.mean())

# Display results
print 'Total number of children with parents: {}\n\
Children with parents who survived: {}\n\
Children with parents who did not survive: {}\n\
Percentage of children who survived: {}%\n\
Average age of surviving children: {}'\
.format(total_children_parents, survived_children_parents,
        total_children_parents-survived_children_parents, pct_survived_parents,survived_children_parents_avg_age)
Total number of children with parents: 81
Children with parents who survived: 45
Children with parents who did not survive: 36
Percentage of children who survived: 55.56%
Average age of surviving children: 7.0
Based on the data analysis above, it would appear that the survival rate for children who were accompanied by parents vs those children accompanied by nannies was slighly higher for those with parents. The slight increase could be due to the average age of children with parents being younger, almost half, that of children with nannies.
- Percentage of children with nannies who survived: 50.0%
- Percentage of children with parents who survived: 55.56%
- Average age of surviving children with nannies: 15
- Average age of surviving children with parents: 7.0
Conclusion
The results of the analysis, although tentative, would appear to indicate that class and sex, namely, being a female with upper social-economic standing (first class), would give one the best chance of survival when the tragedy occurred on the Titanic. Age did not seem to be a major factor. While being a man in third class, gave one the lowest chance of survival. Women and children, across all classes, tend to have a higher survival rate than men in genernal but by no means did being a child or woman guarentee survival. Although, overall, children accompanied by parents (or nannies) had the best survival rate at over 50%.
Issues:
- A portion of men and women did not have Age data and were removed from calculations which could have skewed some numbers
- The category of ‘children’ was assumed to be anyone under the age of 18, using today’s North American standard for adulthood which was certainly not the case in the 1900s
References
- https://www.kaggle.com/c/titanic/data
- http://nbviewer.jupyter.org/github/jvns/pandas-cookbook/tree/master/cookbook/
- https://stanford.edu/~mwaskom/software/seaborn/generated/seaborn.factorplot.ht ml#seaborn.factorplot
- http://www.ncbi.nlm.nih.gov/pmc/articles/PMC3865739/