In a Stroop task, participants are presented with a list of words, with each word displayed in a color of ink. The participant’s task is to say out loud the color of the ink in which the word is printed. The task has two conditions: a congruent words condition, and an incongruent words condition. In the congruent words condition, the words being displayed are color words whose names match the colors in which they are printed: for example RED, BLUE. In the incongruent words condition, the words displayed are color words whose names do not match the colors in which they are printed: for example PURPLE, ORANGE. In each case, we measure the time it takes to name the ink colors in equally-sized lists. Each participant will go through and record a time from each condition.
My test results:
Congruent words - 10.905
Incongruent words - 34.41
1. What is our independent variable? What is our dependent variable?
Independent variable is: The word/colour congruency is the varable being manipulated in the experiment
Dependent variable is: The time it takes to recognize/name the ink colors of the mismatch word/colour congruency
2. What is an appropriate set of hypotheses for this task? What kind of
statistical test do you expect to perform? Justify your choices. Null Hypothsis, H0 - The mismatch of color to word will have no effect or decrease time to recognize and say the color
Alternate Hypothesis, H1 - The mismatch of color to word will increase time to recognize and say the color
H0: μi ≤ μc (μi - population mean of incongruent values, μc - population mean of congruent values)
H1: μi > μc (μi - population mean of incongruent values, μc - population mean of congruent values)
statistical test choices and assumptions
-
95% confidence interval
-
Paired one tail t-test -> with two tests per participant this test show if the mean of incongruent words is statistically significantly different from the congruent words at an alpha of 0.05.
assumptions/why: I will be using a t-test instead of a z-test because 1) the population standard deviation is unknown and 2) the sample set is less than 30. The t-test will be a one tailed t-test i.e. my directional alternative hypothesis is that participant’s incongruent sample mean will be larger than the participant’s congruent sample mean
A paired t-test (or dependent sample test), will be used because the data set is of one group of participants tested twice under different conditions (word/colour congruency). This will also facilitate either rejecting or accepting the null hypothesis.
3. Report some descriptive statistics regarding this dataset. Include at
least one measure of central tendency and at least one measure of variability.
sample size = 24
mean: $xbar = \Sigma{x}/n$ (where xbar is the sample mean, x is the value and n is the number of samples)
Congruent: 14.05, Incogruent: 22.02
median: as the data seems slightly positively skewed, median is a better representation of central tendency
Congruent: 14.3565, Incongruent: 21.0175
sample std. deviation: $\sigma = \Sigma{(x - xbar)^2}/n$
Congruent: 3.56, Incongruent: 4.80
In [6]:
# Render our plots inline
%matplotlib inline

import matplotlib.pyplot as plt
import pandas as pd
import numpy as np

stroop = pd.read_csv("stroopdata.csv")
In [7]:
# dataset
print(stroop)
Congruent Incongruent
0 12.079 19.278
1 16.791 18.741
2 9.564 21.214
3 8.630 15.687
4 14.669 22.803
5 12.238 20.878
6 14.692 24.572
7 8.987 17.394
8 9.401 20.762
9 14.480 26.282
10 22.328 24.524
11 15.298 18.644
12 15.073 17.510
13 16.929 20.330
14 18.200 35.255
15 12.130 22.158
16 18.495 25.139
17 10.639 20.429
18 11.344 17.425
19 12.369 34.288
20 12.944 23.894
21 14.233 17.960
22 19.710 22.058
23 16.004 21.157
In [58]:
# descriptive stats
stroop.describe()| Congruent | Incongruent | |
|---|---|---|
| count | 24.000000 | 24.000000 |
| mean | 14.051125 | 22.015917 |
| std | 3.559358 | 4.797057 |
| min | 8.630000 | 15.687000 |
| 25% | 11.895250 | 18.716750 |
| 50% | 14.356500 | 21.017500 |
| 75% | 16.200750 | 24.051500 |
| max | 22.328000 | 35.255000 |
In [65]:
# median / 50% values
congruent = stroop['Congruent']
incongruent = stroop['Incongruent']
congruent.median(), incongruent.median()
(14.3565, 21.0175)
4. Provide one or two visualizations that show the distribution of the
sample data. Write one or two sentences noting what you observe about the plot or plots.
Plots
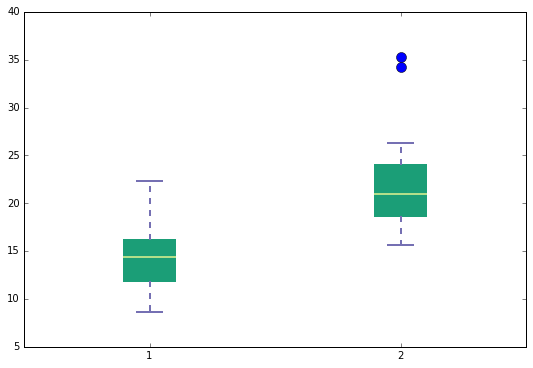
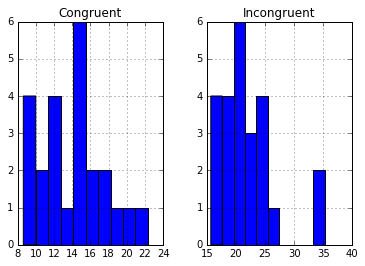
Please see below a boxplot and histogram which show the distribution of data from both congruent and incongruent conditions.
Observations
From the boxplot, there are two somewhat obvious outliers or extraneous data which would possible skew the true mean of incongruent values. And from the histogram plots, although both graphs visually appear somewhat positively skewed, the mean is pretty close to the peak in both graphs which would indicate a normal distribution. Provided these are samples from the population, the sampling mean would be similar to the population mean.
In [59]:
data = np.genfromtxt('stroopdata.csv', delimiter=',',dtype=np.float32)
plt.figure(1, figsize=(9, 6))

plot1 = plt.boxplot(data,vert=True,widths = 0.2,patch_artist=True)

plt.setp(plot1['boxes'], color='#1b9e77', linewidth=2, facecolor='#1b9e77')
plt.setp(plot1['whiskers'], color='#7570b3', linewidth=2)
plt.setp(plot1['caps'], color='#7570b3', linewidth=2)
plt.setp(plot1['fliers'], color='#e7298a', marker='o', markersize=10)
plt.setp(plot1['medians'], color='#b2df8a', linewidth=2)

# histogram
stroop.hist()
array([[<matplotlib.axes._subplots.AxesSubplot object at 0x11e7c3b50>,
<matplotlib.axes._subplots.AxesSubplot object at 0x11e684b10>]], dtype=object)
5. Now, perform the statistical test and report your results. What is your
confidence level and your critical statistic value? Do you reject the null hypothesis or fail to reject it? Come to a conclusion in terms of the experiment task. Did the results match up with your expectations?
mean difference, dbar = $\Sigma (yi − xc)/n$ = 7.964
yi is incongruent, xc is the congruent values, n is the sample set
standard deviation, sd = 4.86
standard error of the difference, SE(dbar) = sd/√n = 4.86/√24 = 0.99
t-statistic, T = dbar/SE(dbar) = 7.964/0.99 = 8.04 on 23df
t-distribution with n-1 degrees of freedom (df = 23). Using the t-distribution table to find p-value…
The value of p is < 0.0001. The result is significant at p < 0.05%
Hypothesis
I reject the null hypothesis, the word/colour incongruent does cause a greater time response
Conclusion
The results match my expectations.
In [5]:
stroop = pd.read_csv("stroopdata_updated.csv")
print(stroop)
Congruent InCongruent Difference Mean Difference Std Deviation
0 12.079 19.278 7.199 7.964792 4.864827
1 16.791 18.741 1.950 NaN NaN
2 9.564 21.214 11.650 NaN NaN
3 8.630 15.687 7.057 NaN NaN
4 14.669 22.803 8.134 NaN NaN
5 12.238 20.878 8.640 NaN NaN
6 14.692 24.572 9.880 NaN NaN
7 8.987 17.394 8.407 NaN NaN
8 9.401 20.762 11.361 NaN NaN
9 14.480 26.282 11.802 NaN NaN
10 22.328 24.524 2.196 NaN NaN
11 15.298 18.644 3.346 NaN NaN
12 15.073 17.510 2.437 NaN NaN
13 16.929 20.330 3.401 NaN NaN
14 18.200 35.255 17.055 NaN NaN
15 12.130 22.158 10.028 NaN NaN
16 18.495 25.139 6.644 NaN NaN
17 10.639 20.429 9.790 NaN NaN
18 11.344 17.425 6.081 NaN NaN
19 12.369 34.288 21.919 NaN NaN
20 12.944 23.894 10.950 NaN NaN
21 14.233 17.960 3.727 NaN NaN
22 19.710 22.058 2.348 NaN NaN
23 16.004 21.157 5.153 NaN NaN
6. Optional: What do you think is responsible for the effects observed? Can
you think of an alternative or similar task that would result in a similar effect? Some research about the problem will be helpful for thinking about these two questions!
I believe it’s a subconscious or habitual behaviour where commonly used words are glanced over and easily recognized in your mind and therefore, because the color and words match, it takes little effort to say the word/colour. However, when the word and colour are mismatched, we first think of the word and then need to correct ourselves to say the colour causing either errors or more time to provide the correct response.
I imagine replacing letters with numbers in the experiment would yeild the same results.
Another similar task: being shown a list of words and asking the user to type (on a qwerty keyboard) commonly used words. First, use a list words with no spelling mistakes and then the same list of words with obviously misspelling or a number in the middle of the word. The reflects of knowing where the keys are positioned and the knoweledge of the correctly spelt word would allow cause the users to produce a fast time for correctly spelt words and a longer time to recognize that the word is spelt incorrectly and having to change their habitual behaviour, causing a lag and longer time to complet the word.
References
https://en.wikipedia.org/wiki/Stroop_effect
http://www.statisticshowto.com/when-to-use-a-t-score-vs-z-score/
http://www.biostathandbook.com/testchoice.html
http://www.ats.ucla.edu/stat/stata/whatstat/whatstat.htm
http://www.statstutor.ac.uk/resources/uploaded/paired-t-test.pdf
https://www.stat.tamu.edu/~lzhou/stat302/T-Table.pdf